A set of soil materials was preselected in order to gain data that are highly coherent and exchangeable between groups. Soils are from well-documented long-term fertilization field experiments. Different sites were selected in order to cover different soil properties, ranging from poorly aggregated sandy soils with low pH and organic carbon (OC) content to well-structured, silt loam soils (providing substantially more microhabitats) with higher pH and OC content. Arable soils were selected, since they are less imprinted by plant cover compared to grassland and forest soils with permanent vegetation and presumably are most sensitive soils with regard to C storage. Arable Cambisol, Retisol and Luvisols are characterized by intensive OC turnover and CO2 release, and are highly representative for arable soils in temperate regions.
We selected the plots ‘unfertilized’ (‘control’) and ‘organically fertilized’ (with addition of farmyard manure and in certain treatments of mineral fertilizers) in order to have pairs of soils with different SOM content and nutrient status but otherwise largely similar composition and properties. The microbial communities of unfertilized soils will be more dominated by fungi while fertilized soils will be more dominated by bacteria (fungal vs. bacterial energy use channel).
At least one soil (Table 1) has to be included in individual projects. Studies using more than one soil also take further soils from the preselected set that covers three ‘texture types’ and combinations of ‘texture types’ and ‘fertilizer variations’, respectively.
Participants of SoilSystems may include additional soil samples from other plots (e.g. with other fertilization management) or sites with different soil composition and properties (e.g. Mollisols). Overall, soils (soil substrates) for investigation should meet the following requirements (such as those proposed in Table 1):
- Topsoil from arable soils,
- with different mineral components/content and/or different SOM,
- from long-term field experiments with good data recording on soil use and properties,
- soils with different fertilization history and nutrient content but without one-sided nutrient limitation (e.g. single nutrient enrichment/depletion trial),
- enthalpies and major element composition of SOM contents should be provided.
Table 1: Topsoils proposed for use in individual studies
| Texture | Site | Trial established | Soil group | Fertilizer treatment | Soil properties |
|---|---|---|---|---|---|
| Silt Loam | Dikopshof, Universität Bonn, Germany | 1940 | Haplic Luvisol (Parabraunerde) | a) unfertilized b) farmyard manure | aggregation moderate, uFCa moderate |
| Sandy Loam | Reckenholz (ZOFE), Agroscope, Zurich, Switzerland | 1949 | Haplic Luvisol (Parabraunerde) | a) unfertilized b) farmyard manure | aggregation moderate, uFCa moderate |
| Loamy Sand | Thyrow, Humboldt-Universität Berlin, Germany | 1937 | Haplic Retisol (Retisol) | a) unfertilized b) farmyard manure | aggregation weak, uFCa low |
| Silt Loam | QualiAgro, INRAe, Orgeval, France | 1998 | Haplic Luvisol (Parabraunerde) | a) unfertilized b) farmyard manure | aggregation moderate-strong, uFCa moderate-high |
The topsoil properties (from 2020) are represented in the following tables (data from Blagodatskaya, Poll, Thiele-Bruhn et al.):
| Parameter | D-FYM | D-UF | R-FYM | R-UF | T-FYM | T-UF | Q-FYM | Q-UF | |
|---|---|---|---|---|---|---|---|---|---|
| TOC | [%] | 0.74 | 0.69 | 1.05 | 0.81 | 0.68 | 0.28 | 1.42 | 0.71 |
| TN | [%] | 0.08 | 0.08 | 0.11 | 0.09 | 0.06 | 0.03 | 0.14 | 0.07 |
| C/N | 9.5 | 8.8 | 9.4 | 9.1 | 11.4 | 11.1 | 10.3 | 9.4 | |
| pH | (CaCl2) | 6.3 | 6.1 | 5.2 | 4.7 | 5.0 | 4.2 | 6.4 | 5.7 |
| P | [mg kg-1] | 57 | 30 | 34 | 28 | 70 | 52 | 84 | 42 |
| K | [mg kg-1] | 161 | 26 | 25 | 9 | 87 | 12 | 322 | 72 |
| Clay | [%] | 15.1 | 16.2 | 15.1 | 14.0 | 5.6 | 5.5 | 13.7 | 15.7 |
| Silt | [%] | 68.9 | 67.3 | 33.8 | 33.2 | 11.1 | 11.1 | 80.9 | 79.8 |
| Sand | [%] | 15.9 | 16.4 | 51.1 | 52.9 | 83.3 | 83.3 | 5.4 | 4.5 |
| Soil Texture | KA5 | Ut3 | Ut3 | Sl4 | Sl4 | Sl2 | Sl2 | Ut3 | Ut3 |
| Soil Texture | WRB | SiL | SiL | L | SL | LS | LS | SiL | SiL |
| Parameter | D-FYM | D-UF | R-FYM | R-UF | T-FYM | T-UF | Q-FYM | Q-UF | |
|---|---|---|---|---|---|---|---|---|---|
| CFE-Cmic | [μg C g-1dw] | 91 | 38 | 142 | 141 | 92 | 36 | 318 | 244 |
| Basal respiration | [μg CO2 h-1 g-1dw] | 0.72 | 0.66 | 1.12 | 0.87 | 0.78 | 0.44 | 1.37 | 1.05 |
| SIR-Cmic | [μg C g-1dw] | 171 | 121 | 182 | 148 | 99 | 54 | 308 | 252 |
| Metabolic quotient | [μg CO2 h-1 g-1Cmic] | 0.0042 | 0.0055 | 0.0061 | 0.0059 | 0.0078 | 0.0082 | 0.0044 | 0.0042 |
| Total PFLAs | [nmol FA g-1dw] | 13.96 | 9.98 | 21.03 | 16.04 | 10.38 | 3.078 | 33.59 | 22.94 |
| Bacterial PLFAs | [nmol FA g-1dw] | 13.23 | 9.44 | 20.09 | 15.32 | 9.56 | 3.34 | 31.62 | 20.93 |
| Gram positive | [nmol FA g-1dw] | 8.05 | 5.85 | 12.96 | 10.04 | 6.50 | 1.83 | 18.31 | 12.35 |
| Gram negative | [nmol FA g-1dw] | 1.59 | 1.25 | 2.17 | 1.57 | 1.24 | 0.91 | 3.38 | 2.84 |
| Fungi | [nmol FA g-1dw] | 0.72 | 0.54 | 0.94 | 0.72 | 0.82 | 0.44 | 1.97 | 2.01 |
| Fungi/ Bacteria | 0.055 | 0.057 | 0.047 | 0.047 | 0.086 | 0.133 | 0.062 | 0.096 | |
| Bacteria | [copies g-1dw] | 4.77E+09 | 2.21E+09 | 1.69E+10 | 6.24E+09 | 2.18E+09 | 3.60E+08 | 1.26E+10 | 5.09E+09 |
| Archaea | [copies g-1dw] | 8.22E+07 | 3.97E+07 | 1.71E+08 | 4.63E+07 | 1.56E+07 | 2.60E+07 | 1.75E+08 | 5.24E+07 |
| Fungi | [copies g-1dw] | 7.10E+07 | 3.12E+07 | 1.64E+08 | 7.55E+07 | 4.90E+07 | 1.31E+07 | 1.37E+08 | 2.98E+08 |
| Parameter | D-FYM | D-UF | R-FYM | R-UF | T-FYM | T-UF | Q-FYM | Q-UF | |
|---|---|---|---|---|---|---|---|---|---|
| Natot | [g kg-1] | 1.7 | 2.6 | 2.3 | 1.8 | 0.9 | 2.0 | 2.4 | 2.6 |
| Ktot | [g kg-1] | 19.1 | 23.4 | 21.8 | 22.2 | 7.0 | 5.0 | 26.5 | 25.8 |
| Catot | [g kg-1] | 10.3 | 11.4 | 7.4 | 6.8 | 2.8 | 0.7 | 11.8 | 16.0 |
| Mgtot | [g kg-1] | 12.1 | 13.8 | 17.0 | 17.1 | 3.3 | 2.7 | 11.8 | 13.1 |
| Altot | [g kg-1] | 73.4 | 94.4 | 88.3 | 93.4 | 28.3 | 28.6 | 83.3 | 100.1 |
| Fetot | [g kg-1] | 72.2 | 78.0 | 64.2 | 64.2 | 21.6 | 20.8 | 68.2 | 83.7 |
| Mntot | [g kg-1] | 2.3 | 2.2 | 1.8 | 1.1 | 0.9 | 1.8 | 2.5 | 2.0 |
| Feo | [g kg-1] | 26.5 | 26.3 | 23.5 | 23.3 | 12.3 | 9.7 | 26.2 | 25.5 |
| Alo | [g kg-1] | 5.9 | 6.4 | 6.9 | 7.8 | 4.9 | 4.3 | 4.6 | 4.6 |
| Mno | [g kg-1] | 4.7 | 4.1 | 3.3 | 3.2 | 1.8 | 1.8 | 3.1 | 3.3 |
| Fed | [g kg-1] | 34.9 | 35.2 | 30.9 | 30.7 | 7.7 | 7.6 | 29.9 | 29.0 |
| Ald | [g kg-1] | 2.7 | 2.6 | 3.7 | 3.6 | 1.9 | 1.8 | 2.1 | 2.4 |
| Mnd | [g kg-1] | 1.8 | 1.8 | 1.3 | 1.4 | 0.8 | 0.6 | 1.2 | 1.3 |
| Feo/Fed | 0.76 | 0.75 | 0.76 | 0.76 | 1.60 | 1.28 | 0.87 | 0.88 | |
| Feo/Fetot | 0.37 | 0.34 | 0.37 | 0.36 | 0.57 | 0.47 | 0.38 | 0.30 |
Finn, D. and Tebbe, C.C. SPP2322: Comparisons of microbial communities between long-term field trials (unpublished results).
The report can be downloaded here.
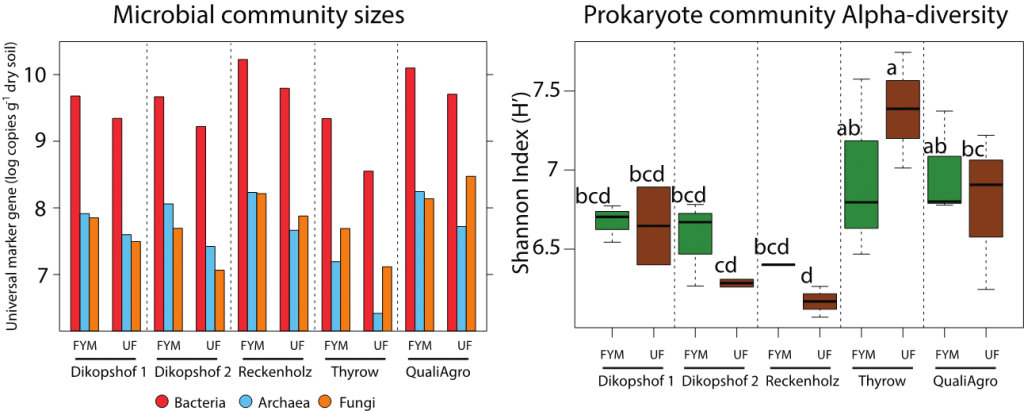
Quantitative PCR and Prokaryote alpha-diversity comparisons between fertilised (FYM) and unfertilised (UF) soils of the five SPP2322 long-term field trials. Post hoc results are shown as letters above H’ measurements.
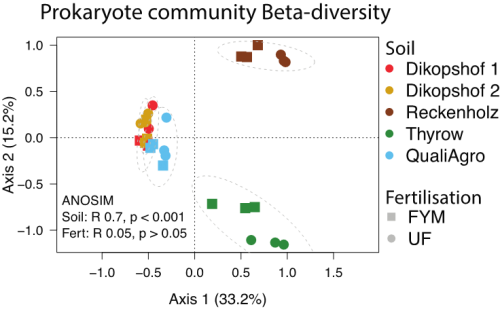
Principle Components Analysis of prokaryote communities within the five SPP2322 long-term field trials. Percent variation explained by the first two axes are noted. Grey dotted lines indicate 95% confidence intervals of each site. Results of Analysis of Similarity (ANOSIM) hypothesis testing for differences between soil and fertilisation are also noted.
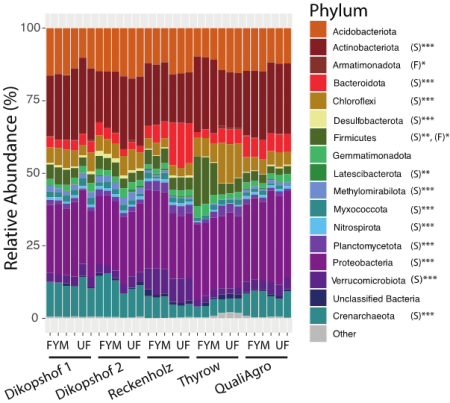
Stacked bar chart of the relative abundances of dominant prokaryote Phyla in fertilised (FYM) and unfertilised (UF) SPP2322 soils. General linear model results of soil (S) and fertilisation (F) effects are noted for each Phylum as: p < 0.001 (***), p = 0.001 (**), p < 0.05 (*). Phyla that comprise less than 5% of the total community are consolidated as the category ‘Other’.